
Statistics for the TV show addict
The year is coming to a close. It has been the most life-changing year of my life (I might post more on that on 31 Dec), but some things never really change: at heart, I am still a TV show addict. It remains my favourite format of consuming fiction (sometimes also non-fiction), and this is clearly reflected in not only the following statistics, but also the fact that I’m so much of a nerd, I actually have a database that allows me to create these statistics.
I started tracking the movies I watch in 2006 as part of a blog challenge. It turned into a bit of an OCD and was soon followed by tracking the TV show episodes I watch (thankfully these days that happens mostly automatically). So just how much of an addict am I? See for yourself.
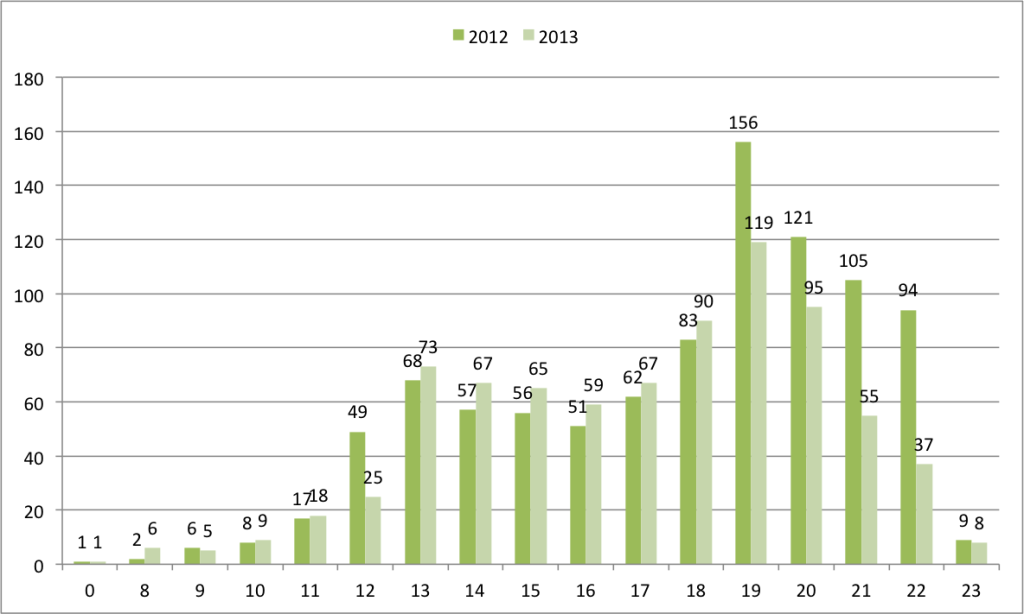
Number of episodes per year
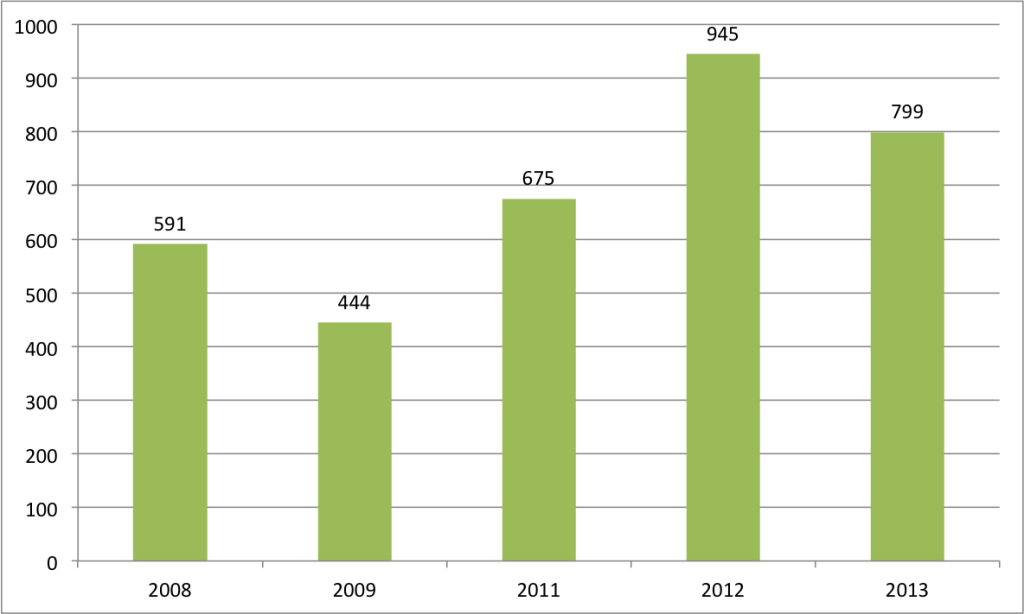
The above graph shows you just how many episodes of TV shows I have watched since I started tracking them in 2008. The keen observer will have noticed that 2010 is missing – sadly a year in which I neglected my OCD and had no automated process yet. Good news: 2013 has not seen a consumption as crazy as 2012. That’s probably because of all the real life and travel that got in the way of my TV.
Movies per year
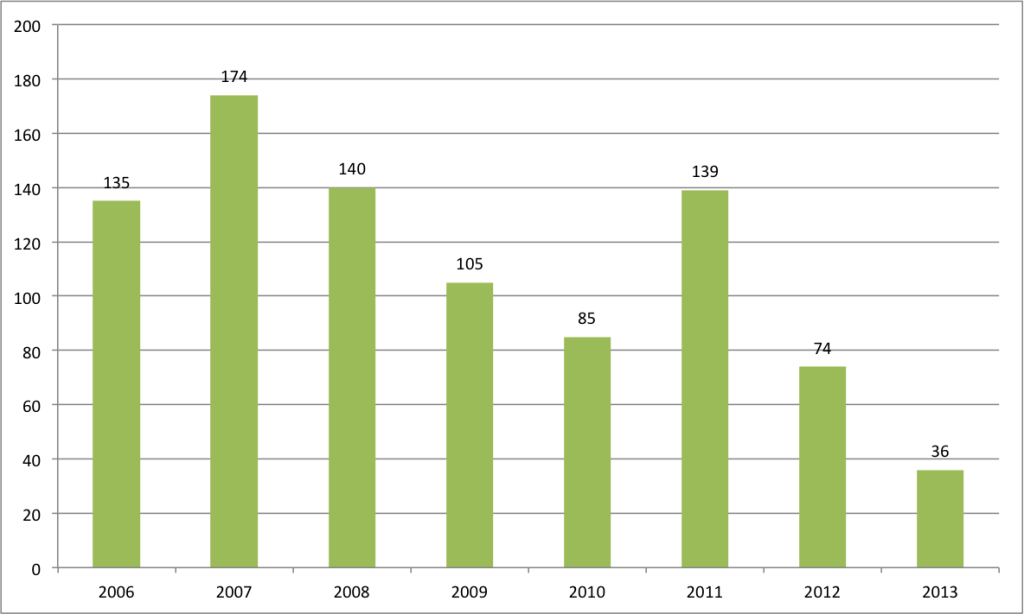
Though movies are not quite the topic of this post, I think a chart for the purpose of comparison is interesting. My movie consumption has fallen dramatically, which I think somewhat coincides with the rise in TV show consumption. Movies are becoming a less and less interesting format and I often have the feeling that I’ve already seen all the good ones.
Episodes per month
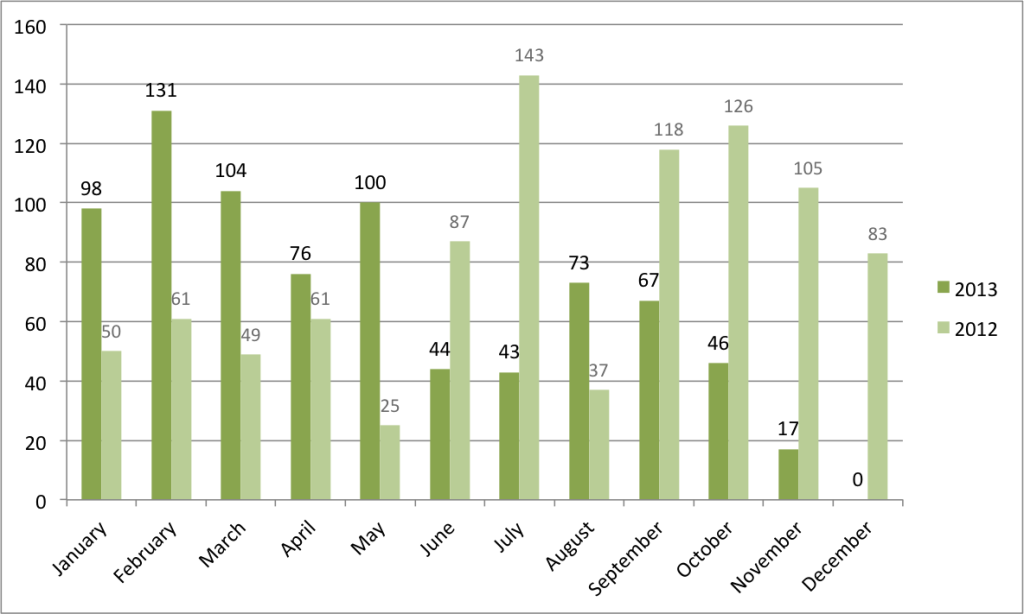
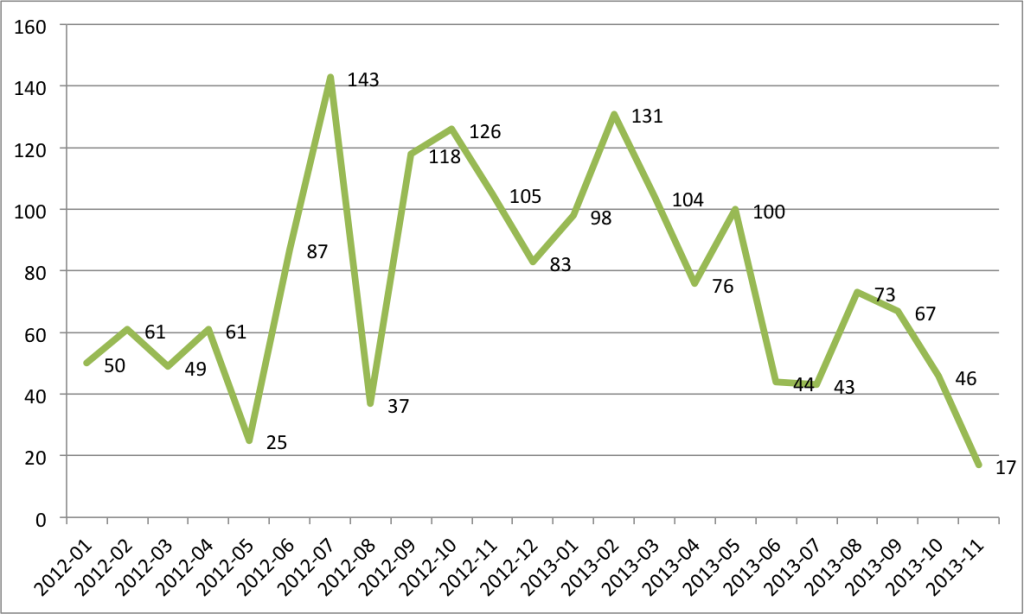
Both of the above graphs depict the number of episodes per month watched in 2012 and 2013. As evident, there was a large rise in late 2012 that continued into early 2013, but still the amount varies greatly. That’s probably due to a variety of factors such as real life interference, weather and addictiveness of whichever show we were watching at the time. Some shows go really really fast, other take ages to watch.
Number of episodes per show in 2013
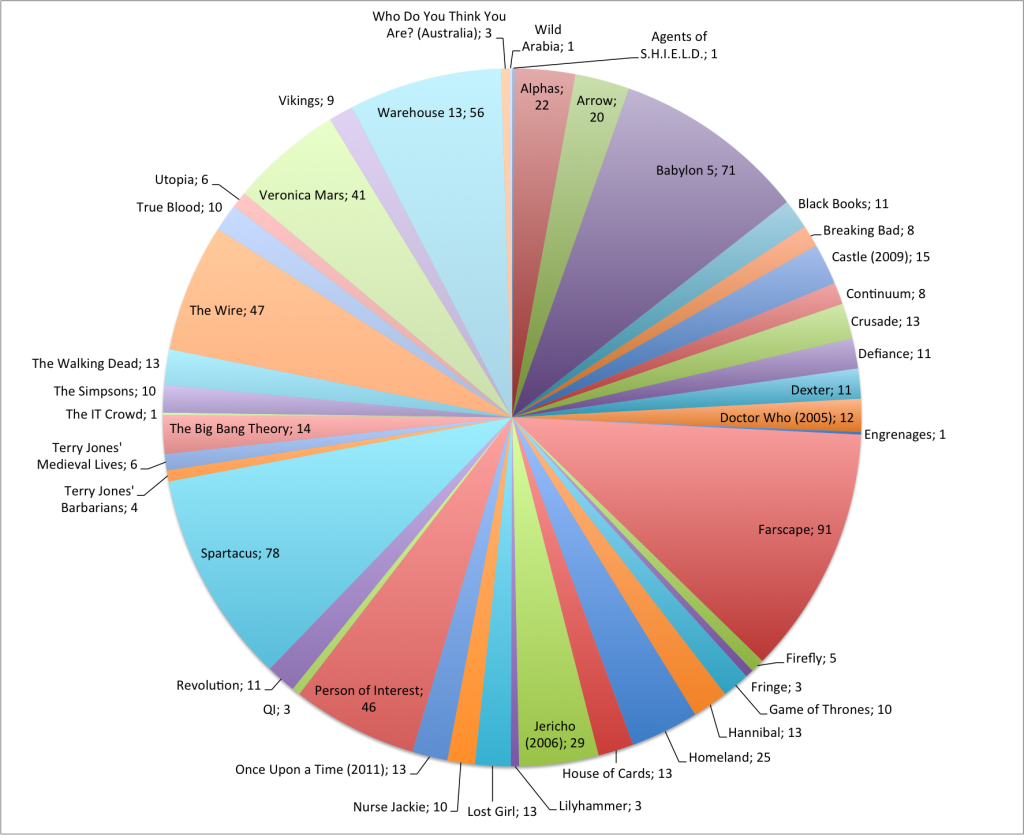
I have watched episodes from a total of 48 different TV shows in 2013. Out of those 23 were new TV shows of which I had not previously watched episodes in 2012 or earlier.
Hours watched per show in 2013
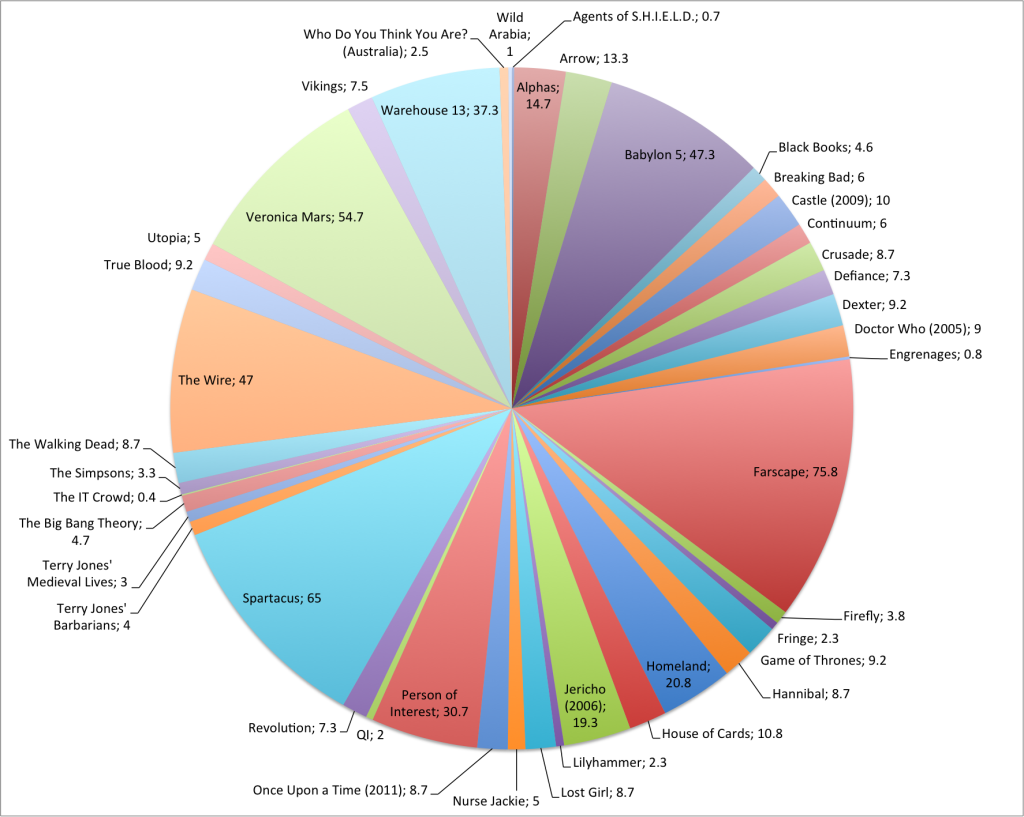
The above graph is nearly identical to the previous one, except that it depict TV shows in 2013 by the amount of time spent on them in hours, as opposed to the number of episodes. This is somewhat important because the graph depicting number of episodes slightly distorts reality; some TV shows have episodes that are only 20 minutes, whereas others may be 60 minutes. However, since I am too lazy to store more data in my database, this graph is based on the length of a regular episode, which for example in the case of Doctor Who (2005) would be 45 minutes. So this graph did not take into account the extra-long length of the recent Doctor Who special.
New vs. old
As already mentioned, I have watched episodes from 23 shows that were new to me in 2013. Among those are: Agents of S.H.I.E.L.D., Crusade, Defiance, Engrenages, Farscape, Hannibal, Homeland, House of Cards, In the Flesh, Jericho (2006), Lilyhammer, Oz, Person of Interest, Spartacus, Terry Jones’ Barbarians, Utopia, Vikings, Warehouse 13 and Wild Arabia.
Watched more than once
In 2013, I have watched episodes from 3 different TV shows more than once: I have watched the episodes “Doctor Who (2005) – 3.10 – Blink” and “Homeland – 1.1 – Pilot” twice. But most striking for these statistics, I have watched the entire series of Spartacus twice, the episode “Spartacus – 1.13 – Blood and Sand: Kill them all” even three times. In addition to that, I have watched a huge amount of scenes so many times I have lost count. Sometimes I would watch pretty much all of the rebel scenes in Vengeance (S2) again while skipping all the Roman scenes. Why this obsession with Spartacus? Read my review and you’ll find out.
Days of the week

The above graph shows on which weekdays I most or least likely to watch TV shows. It’s not particularly suprising: Sunday is the most boring day (especially in Germany, since nothing happens on Sundays in Germany). There appears to be a general trend to watch more towards the end of the week. 2013 shows a dip on Thursdays, which is probably because of the Sci-Fi club meetings I attended during my time at The University of Queensland on Thursday nights.
Hours of the day
This graphs shows during which hour of the day I watched my stuff in 2012 and 2013. There is nothing between 1am and 7am because that’s when I sleep. Very rarely do I watch something in the morning, but depending on how addictive a show is, I might even continue watching first thing as I wake up – it happened with Homeland… Most stuff is watched in the evening, usually at dinner time. Occasionally, such as on weekends, I also watch stuff during lunchtime.
That’s all the graphs I got for now! You are probably still shaking your head in disbelief because I’m such a nerd that I got graphs! Well, I like being able to visualize my TV show addiction. And keep in mind, this is pretty much the only TV I watch – I have no regular TV, I don’t watch crap like the bachelor, top model, whatnot. The only other TV I watch besides this is the occasional Daily Show and Colbert Report, but I don’t track those because I wouldn’t even know how to keep up with that.
What will 2014 bring? Will I watch even more TV shows? Will I finally watch more movies, or even get around to reading books? Who knows… but I can predict a surge in TV shows for February, because I’ve got so much to catch up on after the two months of travelling the southern hemisphere of which I am currently in the middle…
Wow! That’s very cool and really makes me wonder what my own stats would look like. 🙂
How’d you compile all those graphs? Surely that’s not just a big spreadsheet…
Of course not! I have a MySQL database in which all the information is stored. Usually I just get my information from my media center’s database with a select statement, with which I migrate the data every once in a while. During my time in Oz, however, I just manually tracked everything in a csv which I then imported into the database (because no internet).
For the stats, I did a whole bunch of select statements from which I created csvs, which I then loaded into excel and formatted some pretty graphs. I probably could do something with javascript as well, but for this purpose excel was the quicker and easier solution.